Dr. Sude Tavassoli


I'm a computer scientist interested in analyzing modeling decisions for complex systems and analyzing data to answer business questions. One of my favourite topic is ethical AI, exposing possibly hidden influences on our day to day as well as business decision makings. To contact me please use my gmail address: FirstnameLastname
Education
- 06/2018- PhD in Computer Science at Kaiserslautern University of Technology, Germany.
- 01/2011- M.Sc. in Artificial Intelligence at Azad University-Qazvin, Iran.
- 05/2006- B.Sc. in Software Engineering at Azad University-Lahijan, Iran.
Scholarships & Awards
- 06/2017- AMMCS 2017 Partial Travel Award plus Travel Grant of TU-Nachwuchsring based on a competition for a limited number of qualified applicants in order to attend AMMCS2017 congress in Canada.
- 06/2017 to 07/2017- DAAD STIBET Scholarship for international PhD Students at Kaiserslautern University of Technology, Germany.
- 08/2013 to 04/2017- PhD Program Scholarship in Computer Science at Kaiserslautern University of Technology, Germany.
- 11/2016 -Travel Grant of TU-Nachwuchsring for young researchers at Kaiserslautern University to attend an international conference in Italy.
Recent activity:
- Presented a talk on Data Analytics at UFZ
- Attended AI Monday event in Berlin
- PhD defended on "Analyzing centrality indices in complex networks: an approach using fuzzy aggregation operators"
- Invited for a talk in a colloquium in Stuttgart university
- Invited for a talk in "Fair decisions" minisymposium in AMMCS 2017 Conference
- Attended CompleNet2017 in Dubrovnik
- Paper got accepted in CompleNet2017
- Had a presentation in ComplexNetworks2016 in Milan
Main research areas:
- Network Analytic methods (Centrality indices)
- Fuzzy Logic (operators in decision making problems)
- Data Mining Techniques (Classification problems in cancer research)
- Chat-Log data Processing
Collaborators on the different projects:
Conference papers and journal articles
Google Scholar: Dr. Sude Tavassoli- Sude Tavassoli and Katharina A. Zweig. "Fuzzy Centrality Evaluation in Complex and Multiplex Networks." Complex Networks VIII (2017): 31.
- Sude Tavassoli and Katharina A. Zweig, "Analyzing Multiple Rankings of Influential Nodes in Multiplex Networks." In the fifth International Workshop on Complex Networks and their Applications, pp. 135-146. Springer International Publishing, 2016.
- Sude Tavassoli and Katharina A. Zweig, "Most central or least central? How much modeling decisions influence a node's centrality ranking in multiplex networks", In the proceedings of the third European Network Intelligence Conference, pp. 25-32, 2016. doi:10.1109/ENIC.2016.11 (arXiv:1606.05468)
- Sude Tavassoli and Katharina A. Zweig, " Analyzing the activity of a person in a chat by combining network analysis and fuzzy logic", In Advances in Social Networks Analysis and Mining (ASONAM), 2015 IEEE/ACM International Conference, pp.1565-1568, 25-28 Aug. 2015. doi: 10.1145/2808797.2809335
- Sude Tavassoli, Markus Moessner, and Katharina A. Zweig, " Constructing social networks from semi-structured chat-log data,"In Advances in Social Networks Analysis and Mining (ASONAM), 2014 IEEE/ACM International Conference, pp.146-149, 17-20 Aug. 2014. doi: 10.1109/ASONAM.2014.6921575
- Sude Tavassoli and Mahboubeh Yaqubi. “ An Efficient Preprocessing Technique for Noise Reduction in Ear Verification System”, International Journal of Computer Applications 28(1): 34-40, August 2011, Published by Foundation of Computer Science, New York, USA.
- Sude Tavassoli and Samane Tavassoli, “ An Effective Pinglish Filter for Morphological Analyzer of Persian Adjectives ”, International Journal of Computer Applications 28(1): 41-44, August 2011, Published by Foundation of Computer Science, New York, US.
- Sude Tavassoli, Mohammad Saniee Abadeh, “An Efficient method for improvement of cancer classification integrated algorithm”, In the proceedings of 5th international conference on Information and Automation for Sustainability (ICIAFS2010), pp. 388-392, Colombo, Sri Lanka, 17-19 Dec. 2010.
- Somayeh Nabizadeh, Karim Faez, Sude Tavassoli, Alireza Rezvanian, "A Novel Method for Multi-Level Image Thresholding using Particle Swarm Optimization Algorithms", In the Proceedings of IEEE 2010 International Conference on Computer Engineering and Technology (ICCET 2010), vol. 4, pp. 271-275, Chengdu, Sichuan, China, 16-18 April, 2010.
- Sude Tavassoli, Sara Alipour, “A Morphological Analyser For Persian Adjectives and Nouns”, In the Proceedings of IEEE 2010 3rd International Conference on Advanced Computer Theory and Engineering (ICACTE2010), vol. 5, pp. 437-440, Chengdu, China, 20-22 August, 2010.
- Sude Tavassoli, Mahboubeh Yaqubi, Alireza Rezvanian, Mohammad Mehdi Ebadzadeh, "Enhancement of Ear Verification System Performance Using a New Hybrid Denoising Approach (ANFIS-FWS)", In the proceedings of the First International Conference on Integrated Intelligent Computing (ICIIC 2010), pp. 200 - 204, Bangalore, India, 5-7 August, 2010.
- Sude Tavassoli, Alireza Rezvanian, Mohammad Mehdi Ebadzadeh, "A New Method for Impulse Noise Reduction from Digital Images Based on Adaptive Neuro-Fuzzy System and Fuzzy Wavelet Shrinkage", In the proceedings of IEEE International Conference on Computer Engineering and Technology (ICCET 2010), vol. 4, pp. 297-301, Chengdu, Sichuan, China, 16-18 April, 2010.
Posters
-
Sude Tavassoli, Markus Moessner, Katharina A. Zweig, “Group chat analysis using network analytic approaches: Interpreting a psychotherapeutic process”, International School and Conference on Network Science (NetSci2015), Zaragoza, Spain, 1-5 June, 2015.
-
Sude Tavassoli, Markus Moessner, Katharina A. Zweig, “Constructing social networks from semi-structured chat-log data”, Computational Social Science Winter Symposium, Cologne, 1st of December, 2014.
Books (Persian), Titles are translated to ENG
-
Mahboubeh Yaqubi, Sude Tavassoli,”Artificial Intelligence”, Iran, Lahijan: Islamic Azad University of Lahijan, 2014, Print. (ISBN: 978-964-10-2727-0)
Conference papers (Persian), Titles are translated to ENG
-
Nazanin Kavehpur, Sude Tavassoli,”A New Method in Rain Fall Forecasting Using Nerual Networks”, 3rd National Conference on Computer Engineering and Information Engineering (CEIT 2011), Hamedan, Iran, 17 February, 2011.
-
Sude Tavassoli, Mohammad Saniee Abadeh, “Cancer Classification Improvement Using Random Forest Classifier”, 3rd National Conference on Computer Engineering and Information Engineering (CEIT 2011), Hamedan, Iran, 17 February, 2011.
-
Sude Tavassoli, Mahboubeh Yaqubi, Alireza Rezvanian, “Appropriate Preprocessing to Raise Performance of a Verification System Using Ear Biometric”, 6th Iranian Machine Vision & Image Processing Conference (MVIP 2010), University of Isfahan, Isfahan, Iran, 27-28 October 2010.
-
Sude Tavassoli, Alireza Rezvanian, Mohammad Mehdi Ebadzadeh, " A Hybrid Denoising Method for Digital Images with ANFIS and Fuzzy Wavelet Shrinkage", 10th Iranian Conference on Fuzzy Systems (IFS 2010), Shahid Beheshti University, Tehran, Iran, 13-15 July 2010.
-
Sude Tavassoli, Mahboubeh Yaqubi, Alireza Rezvanian, "A Survey on Feature Extraction Approaches for Palm and Fingerprint", In Proceedings of the 12th Iranian Student Conference on Electrical Engineering (ISCEE 2009), Tabriz, Iran, 13-15 August 2009.
Conferences and Talks
-
2019
- Helmholtz EnvironmentalResearch CenterData Analytics and Beyond,Leipzig, Germany
-
2018
- CretaColloquiumCenter for Reflected Text Analytics, Stuttgart University, Germany
-
2017
- AMMCS'17 Fair Decisions Mini-symposium, Waterloo, Canada
- CompleNet'17 Complex Networks conference, Dubrovnik, Croatia
-
2016
- ComplexNetwork'16 Complex Networks Conference, Milan, Italy
- ENIC'16 European Network Intelligence Conference, Wroclaw, Poland
- CCS'16 Conference on Complex Systems, Amsterdam, Netherlands
- 2015
- 2014
-
2011
- CEIT'11 National Conference on Computer Engineering and Information Technology, Hamedan, Iran
- 2010
Projects
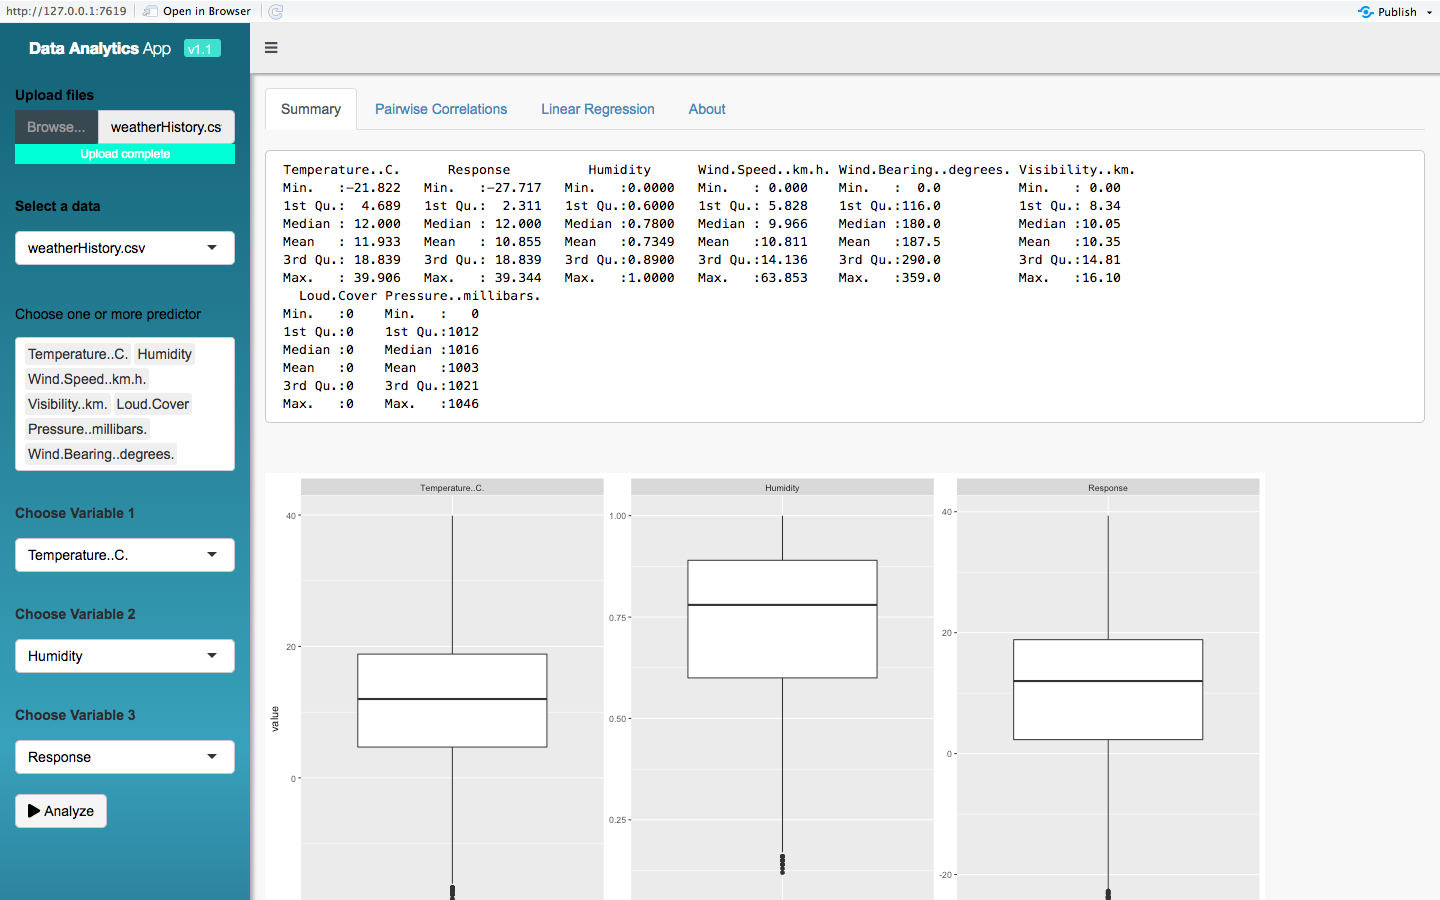
Data analytics Dashboard
Visualizing insights from data
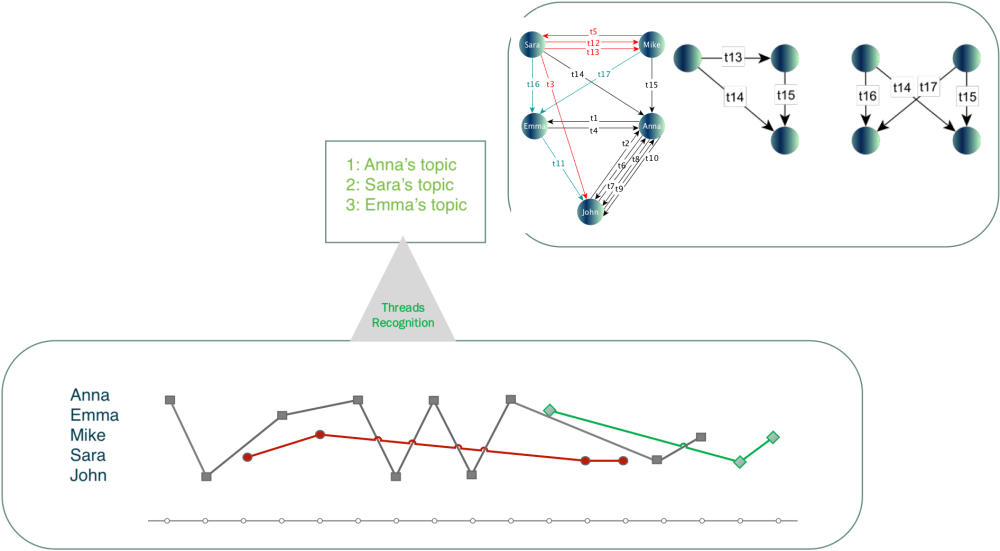
Chat-log Network Analysis
Understanding user behaviour- What is the definition of activity in a chat session?
- How do we measure the activity of users in an
observation time slot?
- Does it make sense at all if we look for motifs disregarding the chat topics?
- By which criteria can we evaluate the significance of
each conversation thread?

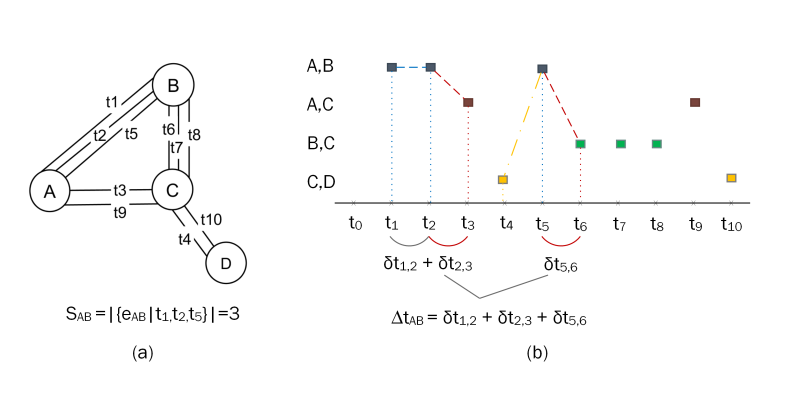
Figure: (a) a time-stamped multi-graph in which every connection between a pair of vertices has a label showing its time of incidence. S AB shows the frequency of sending/receiving messages between the users A and B.
(b) each edge between two vertices (i,j) has a unique time of occurrence in an observation time period T. The dashed line between every pair of time labels (tk-1, tk ) represents the duration that two users interact until a new pair of users start chatting. And, \Delta AB shows the summation of these durations, when a pair of users were engaged in sending/receiving ms in an observation time section T (t1 to t10).

For designing the knowledge framework proposed in paper [7], Weka is used.
_logo.png)
For developing lexicons and designing the morphological analyzer proposed in papers [6,9], we used xerox finite state (lexc language). All the lexicons are available on Github.